
译者按:从1961年开始,巴菲特有时会在一年内写超过一封股东信。为便于查阅,我计划将文章标题调整为巴菲特写信时的年份。本篇股东信写于1961年1月,主要是回顾1960年的情况。
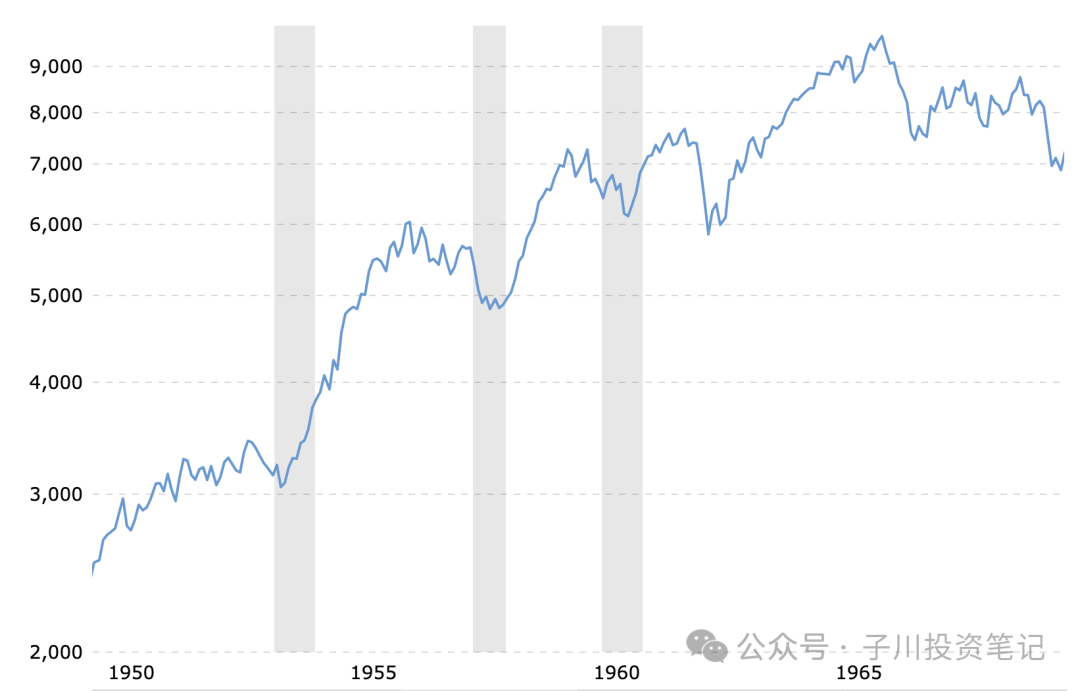
道琼斯工业指数(来源:https://www.macrotrends.net/1319/dow-jones-100-year-historical-chart)
1960年,道琼斯工业指数出现回调。同年,巴菲特对控制桑伯恩地图公司代理权的部署已基本完成,本篇股东信对此给出了较为详尽的情况分析。在桑伯恩地图案例中,巴菲特赢得了大部分股东、管理层和已故总裁的遗孀和儿子的认同,将公司引向为股东兑现/创造更大价值的方向。
公司到底是股东的、董事会的、管理层的、员工的、社区的、社会的,还是国家的?从上世纪五六十年代“股东积极主义”兴起,八十年代末的雷诺兹-纳贝斯克世纪收购案,及至今日,这个问题在不同国家和市场中都尚未有定论。
“买股票就是买公司,就是买公司的未来现金流”,“长期来看股市是价值的称重机”,应用这些理论的前置条件是要搞清楚除了买入股票所花的资金,还需要额外付出多大交易外成本,才能获得标的公司的多少价值。“不懂不做”不止适用于企业估值,其适用范围还囊括了整个投资生命周期的各种风险。历史上,一个资产负债、现金流非常好的公司,不恰当运用可分配收益的例子比比皆是。
本篇股东信的前半部分也较为详细的说明了巴菲特旗下合伙企业的组成和运营逻辑,到1962年,几家合伙企业就要合并了。巴菲特投资实体的变迁历史同样值得揣摩。
1960 Letter
WARREN E. BUFFETT
5202 Underwood Ave. Omaha, Nebraska
1960年股市概况:
一年前,我曾说过1959年道琼斯工业平均指数的画面已经涨的有些失真,该指数从583点上升到679点,涨幅16.4%。尽管几乎所有投资公司在那年都斩获收益,但其中只有不到10%的业绩能够或超越匹敌工业平均指数。同年,道琼斯公用事业平均指数略有下降,而铁路平均指数则大幅下跌。
去年,也就是1960年,情况逆转。工业平均指数从679点下降到616点,跌幅为9.3%。即使算上持有该指数获得的股息,整体损失仍有6.3%。另一方面,公用事业平均指数增长良好,虽然尚未公布所有投资公司的表现结果,但我猜测其中大约九成将优于工业平均指数。今年,大多数投资公司的整体收益似乎都在正负5%的范围内;在纽约证券交易所,653支普通股出现亏损,404支仍有增长。
1960年业绩:
我管理合伙基金的可持续目标是实现比工业平均指数更优越的长期业绩纪录。我相信长期来看,这个平均指数或多或少会与业内领先的投资公司业绩相近。除非我们能实现更优越的表现,否则就没理由继续运营自己的合伙企业。
然而,我之前曾指出,对于任何我们可能实现的优越记录,都不应期待它们恒久优于平均指数。相反,这种优势,很可能在稳定或下跌的市场中表现优于平均水平;而在上涨的市场中表现平平,甚至可能低于平均水平。
就评估标准来说,我会认为,我们的业绩下降15%而平均指数下降30%的年份,要远优于我们和平均指数都上涨20%的年份。总有丰年灾年,为好坏年份出现的顺序感到兴奋或沮丧没什么意义。预先假设我们是遇到三杆洞还是五杆洞很不现实,重要的是超越标准水平,在三杆洞打出四杆远不如在五杆洞打出五杆。
译者注:巴菲特用这个比喻来说明:在不同的市场条件下,表现的好坏不能仅仅看绝对数字,而要看与标准比较的相对表现。就像在高尔夫中,虽然四杆和五杆都是打完一个洞,但在不同的标准杆数下,五杆在五杆洞中比四杆在三杆洞中表现得更好。
今年我们有许多新合伙人,再次阐述以上投资哲学,是想确保新合伙人理解我的目标、我对实现目标的衡量标准以及我知道的一些局限性。
在以上背景下,我们并不意外1960年是一个优于平均水平的年份。与工业平均指数整体损失6.3%相比,我们全年运营的七个合伙企业获得了22.8%的收益。下表展示了合伙企业完整运营四年的结果,已扣除各种费用,但未计算应支付给有限合伙人的利息和应支付给普通合伙人的利润分成:
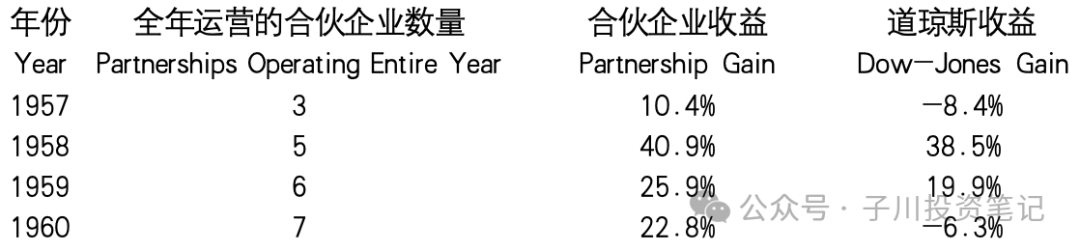
需要再次强调,以上数据是合伙企业的净业绩;有限合伙人的净业绩则取决于他们选择的合伙协议。
整体收益或损失是基于资产市值计算的。在考虑任何增加或撤回的资金后,这种方法给出的,是基于年初合伙企业清算价格和年末将实现清算价格的结果,显然,这与我们的税务结果不同,后者是按成本对证券进行估值,并仅在证券实际出售时实现收益或损失。
按复利计算,累计业绩为:
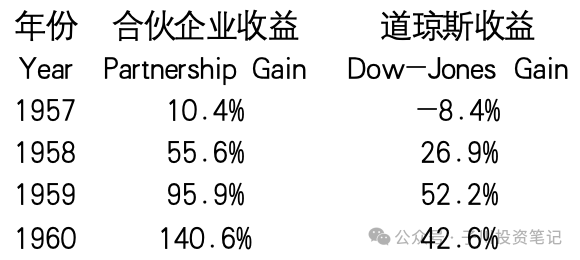
尽管四年时间还太短,不足以得出结论,但现有证据表明,我们的业绩在适度下跌或静止的市场中应该相对更好。倘若这个判断正确,就表明虽然我们的投资方式并不那么传统,但我们的投资组合可能比持有“蓝筹股”证券更为保守。在蓝筹股强劲上涨时,我们可能很难与其表现匹敌。
合伙企业的多样性:
前面的表格也显示出,我们的合伙企业数量逐渐扩大。与我们的整体平均业绩相比,没有哪个合伙企业一直占优或处于劣势。但是即便我努力“让所有合伙企业投资于相同证券并以大致相同比例进行投资”,每年合伙企业间的表现仍有一些差异。当然,我们可以通过将现有合伙企业合并成一个大型合伙企业消除这些差异。合并的举动也会免除许多繁琐营运细节和降低一定开支。
坦率地说,我希望在未来几年内在合并合伙企业方面有所作为。问题是,每个合伙人对合伙安排的偏好不同。我们在未取得合伙人一致同意前,暂时不会有下一步动作。
预付款:
几位合伙人询问了在年内向其合伙企业增资的问题。尽管有过一个增资的例外,但因为在有限合伙人中有多个不同合伙人群体,所以在年中修改合伙协议太过困难。这也导致,在混合合伙企业中,额外权益只能在年末获得。
我们确实接受在一年中支付的预付款,从收到日起至当年末按6%的利率支付利息。年尾,我们在合伙人的同意下完成协议修改后,预付款和利息将被加入合伙资本,并分享之后的利润和损失。
桑伯恩地图(Sanborn Map):
我们去年提到了一项投资,该笔投资不寻常地占据了我们高达35%的净资产。我当时说,希望这项投资能在1960年完成。现在这个愿望实现了。如此大规模投资的过程,可能会引起你的兴趣。
桑伯恩地图公司从事地图出版和持续修订业务,为美国所有城市提供极其详细的地图。例如奥马哈地图分卷,就可能重达五十磅,里面有每个建筑的详细信息。地图用粘贴覆盖的方法做持续修订,包括显示新建筑、占地用途变更、新消防设施和结构材料变更等等。这些修订大约每年进行一次;每隔二三十年,公司无法继续粘贴覆盖更新地图时,就会发行新版。对奥马哈客户而言,地图更新服务,每年大约需花费100美元。
地图上的详细信息显示了街区下方供水管道的直径、消防栓位置、屋顶材料结构等,主要是火灾保险公司使用这些信息。保险公司的承保部门一般设立在总部,通过全国业务员评估具体业务。理论上,一图胜千言,评估将决定风险是否得到正确识别、某个地区的火灾暴露程度、建议的再保险程序等。桑伯恩大部分业务是与大约三十家保险公司进行的,地图也出售给保险业以外的客户,如公用事业公司、抵押贷款公司和税务机关。
七十五年来,该业务或多或少以垄断方式运营,每年都实现利润,几乎完全免受经济衰退的影响,也不需要任何销售努力。在业务早期,保险业担心桑伯恩的利润会变得太大,就在桑伯恩董事会中安插了一些保险业知名人士,起到监督作用。
译者注:桑伯恩董事会中的保守保险业代表来源于此。
50年代初,保险公司开始采用更具竞争力的“计分卡”方法计算承保条件,这损害了桑伯恩的地图业务。该业务的税后利润,从30年代末每年超过50万美元的平均水平,跌至1958、1959年不到10万美元。考虑到这一时期经济的上升趋势,新的保险评估方法引入几乎完全消除了桑伯恩过去可观而稳定的盈利能力。
译者注:在20世纪50年代,美国保险业开始采用更标准化的评分系统。这些系统通过量化风险因素来提高承保效率和一致性。评分系统的引入使得保险公司能够更快速地评估风险,并制定更具竞争力的保费和承保条件。这种变化可能对依赖详细信息的传统方法(如 桑伯恩的地图业务)产生了影响。
然而,在30年代早期,桑伯恩开始积累一项投资组合。它本身的地图业务并不需要额外资本,所有留存收益都可以用来投入该投资组合。随时间推移,累计投入约250万美元,大约一半是债券,一半是股票。因此,特别是在过去十年,虽然地图业务持续萎缩,但这项投资组合却增长喜人。
让我给你们讲下,桑伯恩“地图服务”和“投资组合”,这两项业务的发展有多么不均衡。1938年,道琼斯工业平均指数在100-120,彼时桑伯恩的股价为每股110美元。1958年,平均指数在550左右,桑伯恩的的股价为每股45美元。在同一时期,桑伯恩投资组合的价值从每股约20美元增加到每股65美元。这实际意味着,1938年,在商业和股票市场低迷的一年中,购买桑伯恩股票的买家对地图业务的估值为美股90美元(110美元减去与地图业务无关投资的20美元)。在1958年极其活跃的市场环境中,同样的地图业务被评估为负20美元。这相当于,即使地图业务白送,股票买家也不愿为价值1美元的投资组合支付超过70美分的价格。
译者注:1958年,投资组合价值为每股65美元,股票价格为45美元,在地图业务白送的情况下,约等于投资组合按其价格7折售出(45/65=0.69)。
这怎么可能?桑伯恩在1958年和1938年,都拥有对保险业具有重大价值的信息资产。要复刻他们多年来收集到的详细信息,需耗费数千万美元。尽管保险业开始采用‘计分卡’方法,“地图”公司仍为超过5亿美元的火灾保费提供了承保业务的支持服务。当然,桑伯恩的产品销售和包装形式多年来故步自封,这种惯性也最终反映到业绩中去。
投资组合表现如此出色,降低了大多数董事重振地图业务的需求。桑伯恩的年销售额约为200万美元,拥有约700万美元的可交易证券。投资组合的收入相当可观,业务出现财务问题的可能性不大,保险公司对支付地图服务的价格感到满意,股东仍然能获得股息。然而,这些股息在八年内被削减了五次,尽管我从未找到任何关于削减工资或董事和委员会费用的建议记录。
译者注:除了股东,所有董事和业务伙伴(都是保险公司系的),均对公司现状感到满意。一个好的现金牛,利润丰厚,董事会非常满意,至于股价和公司估值,低些才好。那个年代,甚至有些公司为了降低外部狙击手看上公司,放出烟雾弹说公司实际经营非常之差。
在我进入董事会之前,十四名董事中有九名是保险业知名人士,他们合计持有105,000股流通股中的46股。尽管他们在非常大的公司中担任高层职位,有足够财力做出至少适度的承诺性投资,但他们的持股量却非常少,最多的也仅有十股。这些人经营的保险公司也拥有少量桑伯恩股票,数量相对于这些保险公司所持有投资组合来说少得可怜,只算得上是象征性投资。过去十年,这些保险公司在任何涉及桑伯恩股票的交易中,始终是卖方。
第十位董事是公司律师,持有十股。第十一位是银行家,持有十股,他认识到并积极指出了公司存在的问题,也在后来增加了他的持股量。接下来的两位董事是桑伯恩的高级管理人员,他们合计拥有约300股。管理人员能力出众,意识到业务问题,却被董事会置于从属地位。我们出场演员阵容的最后一位是桑伯恩已故总裁的儿子。另外,已故总裁的遗孀拥有约15,000股股票。
1958年末,已故总裁儿子对公司发展感到不满,希望出任公司最高职位,遭到拒绝;他随后提交辞呈,结果却被接受了。不久后,我们向他母亲提出购买她持有股票的报价,并获得了同意。当时还有另外两个大额持股者,一个约10,000股(分散在一家经纪公司的客户中),另一个约8,000股。这些人对公司现状也非常不满,希望将投资组合与地图业务分开,这和我们的观点完全一致。
随后,通过公开市场购买,我们的持股(包括关联公司)增加到约24,000股。这样,三个群体的总持股数增至46,000股。我们希望分开“投资组合”和“地图”两项业务,既实现前者的公允价值,同时也努力重振后者的盈利能力。利用桑伯恩丰富的原始数据,并结合电子手段,将这些数据转换为对客户最有用处的产品形态,地图业务的利润似乎真有机会增加。
译者注:巴菲特对保险公司董事反对自己的意见很恼火。他的合伙公司和朋友圈子继续增持更多股票(甚至巴菲特说服他父亲经纪公司里的客户购买)。所以最终巴菲特合伙企业持有2.4万股,占22.8%。他的投资伙伴持们有21%左右的股份。获得了足够的投票权。(参考文献:《巴菲特的第一桶金》)
董事会强烈反对任何变革,特别是外部人士发起的提议,即便管理层完全同意我们的计划,并且Booz, Allen& Hamilton(管理专家)也推荐了类似的计划,也是如此。为了避免代理权争夺(这很可能不会发生,发生了我们也肯定会赢),并避免时间延误(因为桑伯恩大部分资金都困在一些蓝筹股上,我并不看好这些股票的现价),我们制定了一个计划,以公允价值收购所有想要退出股东持有的股票。美国证券交易委员会(SEC)对该计划的公平性作出了有利裁决。约72%的桑伯恩股票,涉及1,600名股东中的50%,将以公允价值交换为投资组合证券。地图业务则保留了超过125万美元的政府和市政债券作为储备基金,并同时免除了超过100万美元的公司潜在资本利得税。留下来的股东获得了略微改善的资产价值,明显提升的每股收益和更高的股息率。
以上小插曲只是对这次投资操作的简要描述。不过,它确实说明,对操作投资组合保密的必要性;也表明衡量我们的短期业绩(如一年内)是徒劳无功的。过去,我们控制被投企业的情况可能很少发生。我们的基本业务模式是购买低估证券,并在低估得到纠正时出售;同时我们也投资一些,利润取决于公司行为而非市场行为的特殊机会。但随着合伙基金规模的持续增长,可能会有更多机会让我们采取“控制被投企业”的业务模式。
审计师应在大约一周内邮寄您的财务报表和税务信息。如果您对他们的报告或这封信有任何疑问,请务必告知我。
沃伦·E·巴菲特 1961年1月30
1960 Letter
WARREN E. BUFFETT
5202 Underwood Ave. Omaha, Nebraska
The General Stock Market in 1960:
A year ago, I commented on the somewhat faulty picture presented in 1959 by the Dow-Jones Industrial Average which had advanced from 583 to 679, or 16.4%. Although practically all investment companies showed gains for that year, less than 10% of them were able to match or better the record of the Industrial Average. The Dow-Jones Utility Average had a small decline and the Railroad Average recorded a substantial one.
In 1960, the picture was reversed. The Industrial Average declined from 679 to 616, or 9.3%. Adding back the dividends which would have been received through ownership of the Average still left it with an overall loss of 6.3%. On the other hand, the Utility Average showed a good gain and, while all the results are not now available, my guess is that about 90% of all investment companies outperformed the Industrial Average. The majority of investment companies appear to have ended the year with overall results in the range of plus or minus 5%. On the New York Stock Exchange, 653 common stocks registered losses for the year while 404 showed gains.
Results in 1960:
My continual objective in managing partnership funds is to achieve a long-term performance record superior to that of the Industrial Average. I believe this Average, over a period of years, will more or less parallel the results of leading investment companies. Unless we do achieve this superior performance there is no reason for existence of the partnerships.
However, I have pointed out that any superior record which we might accomplish should not be expected to be evidenced by a relatively constant advantage in performance compared to the Average. Rather it is likely that if such an advantage is achieved, it will be through better-than-average performance in stable or declining markets and average, or perhaps even poorer- than-average performance in rising markets.
I would consider a year in which we declined 15% and the Average 30% to be much superior to a year when both we and the Average advanced 20%. Over a period of time there are going to be good and bad years; there is nothing to be gained by getting enthused or depressed about the sequence in which they occur. The important thing is to be beating par; a four on a par three hole is not as good as a five on a par five hole and it is unrealistic to assume we are not going to have our share of both par three's and par five's.
The above dose of philosophy is being dispensed since we have a number of new partners this year and I want to make sure they understand my objectives, my measure of attainment of these objectives, and some of my known limitations.
With this background it is not unexpected that 1960 was a better-than-average year for us. As contrasted with an overall loss of 6.3% for the Industrial Average, we had a 22.8% gain for the seven partnerships operating throughout the year. Our results for the four complete years of partnership operation after expenses but before interest to limited partners or allocation to the general partner are:
It should be emphasized again that these are the net results to the partnership; the net results to the limited partners would depend on the partnership agreement that they had selected.
The overall gain or loss is computed on a market to market basis. After allowing for any money added or withdrawn, such a method gives results based upon what would have been realized upon liquidation of the partnership at the beginning, of the year and what would have been realized upon liquidation at year end and is different, of course, from our tax results, which value securities at cost and realize gains or losses only when securities are actually sold.
On a compounded basis, the cumulative results have been:
Although four years is entirely too short a period from which to make deductions, what evidence there is points toward confirming the proposition that our results should be relatively better in moderately declining or static markets. To the extent that this is true, it indicates that our portfolio may be more conservatively, although decidedly less conventionally, invested than if we owned "blue-chip" securities. During a strongly rising market for the latter, we might have real difficulty in matching their performance.
Multiplicity of Partnerships:
A preceding table shows that the family is growing. There has been no partnership which has had a consistently superior or inferior record compared to our group average, but there has been some variance each year despite my efforts to "keep all partnerships invested in the same securities and in about the same proportions. This variation, of course, could be eliminated by combining the present partnerships into one large partnership. Such a move would also eliminate much detail and a moderate amount of expense.
Frankly, I am hopeful of doing something along this line in the next few years. The problem is that various partners have expressed preferences for varying partnership arrangements. Nothing will be done without unanimous consent of partners.
Advance Payments:
Several partners have inquired about adding money during the year to their partnership. Although an exception has been made, it is too difficult to amend partnership agreements during mid-year where we have more than one family represented among the limited partners. Therefore, in mixed partnerships an additional interest can only be acquired at the end of the year.
We do accept advance payments during the year toward a partnership interest and pay interest at 6% on this payment from the time received until the end of the year. At that time, subject to amendment of the agreement by the partners, the payment plus interest is added to the partnership capital and thereafter participates in profits and losses.
Sanborn Map:
Last year mention was made of an investment which accounted for a very high and unusual proportion (35%) of our net assets along with the comment that I had some hope this investment would be concluded in 1960. This hope materialized. The history of an investment of this magnitude may be of interest to you.
Sanborn Map Co. is engaged in the publication and continuous revision of extremely detailed maps of all cities of the United States. For example, the volumes mapping Omaha would weigh perhaps fifty pounds and provide minute details on each structure. The map would be revised by the paste-over method showing new construction, changed occupancy, new fire protection facilities, changed structural materials, etc. These revisions would be done approximately annually and a new map would be published every twenty or thirty years when further pasteovers became impractical. The cost of keeping the map revised to an Omaha customer would run around $100 per year.
This detailed information showing diameter of water mains underlying streets, location of fire hydrants, composition of roof, etc., was primarily of use to fire insurance companies. Their underwriting departments, located in a central office, could evaluate business by agents nationally. The theory was that a picture was worth a thousand words and such evaluation would decide whether the risk was properly rated, the degree of conflagration exposure in an area, advisable reinsurance procedure, etc. The bulk of Sanborn's business was done with about thirty insurance companies although maps were also sold to customers outside the insurance industry such as public utilities, mortgage companies, and taxing authorities.
For seventy-five years the business operated in a more or less monopolistic manner, with profits realized in every year accompanied by almost complete immunity to recession and lack of need for any sales effort. In the earlier years of the business, the insurance industry became fearful that Sanborn's profits would become too great and placed a number of prominent insurance men on Sanborn's board of directors to act in a watch-dog capacity.
In the early 1950’s a competitive method of under-writing known as "carding" made inroads on Sanborn’s business and after-tax profits of the map business fell from an average annual level of over $500,000 in the late 1930's to under $100,000 in 1958 and 1959. Considering the upward bias in the economy during this period, this amounted to an almost complete elimination of what had been sizable, stable earning power.
However, during the early 1930's Sanborn had begun to accumulate an investment portfolio. There were no capital requirements to the business so that any retained earnings could be devoted to this project. Over a period of time, about $2.5 million was invested, roughly half in bonds and half in stocks. Thus, in the last decade particularly, the investment portfolio blossomed while the operating map business wilted.
Let me give you some idea of the extreme divergence of these two factors. In 1938 when the Dow-Jones Industrial Average was in the 100-120 range, Sanborn sold at $110 per share. In 1958 with the Average in the 550 area, Sanborn sold at $45 per share. Yet during that same period the value of the Sanborn investment portfolio increased from about $20 per share to $65 per share. This means, in effect, that the buyer of Sanborn stock in 1938 was placing a positive valuation of $90 per share on the map business ($110 less the $20 value of the investments unrelated to the map business) in a year of depressed business and stock market conditions. In the tremendously more vigorous climate of 1958 the same map business was evaluated at a minus $20 with the buyer of the stock unwilling to pay more than 70 cents on the dollar for the investment portfolio with the map business thrown in for nothing.
How could this come about? Sanborn in 1958 as well as 1938 possessed a wealth of information of substantial value to the insurance industry. To reproduce the detailed information they had gathered over the years would have cost tens of millions of dollars. Despite “carding” over $500 million of fire premiums were underwritten by “mapping” companies. However, the means of selling and packaging Sanborn’s product, information had remained unchanged throughout the year and finally this inertia was reflected in the earnings.
The very fact that the investment portfolio had done so well served to minimize in the eyes of most directors the need for rejuvenation of the map business. Sanborn had a sales volume of about $2 million per year and owned about $7 million worth of marketable securities. The income from the investment portfolio was substantial, the business had no possible financial worries, the insurance companies were satisfied with the price paid for maps, and the stockholders still received dividends. However, these dividends were cut five times in eight years although I could never find any record of suggestions pertaining to cutting salaries or director's and committee fees.
Prior to my entry on the Board, of the fourteen directors, nine were prominent men from the insurance industry who combined held 46 shares of stock out of 105,000 shares outstanding. Despite their top positions with very large companies which would suggest the financial wherewithal to make at least a modest commitment, the largest holding in this group was ten shares. In several cases, the insurance companies these men ran owned small blocks of stock but these were token investments in relation to the portfolios in which they were held. For the past decade the insurance companies had been only sellers in any transactions involving Sanborn stock.
The tenth director was the company attorney, who held ten shares. The eleventh was a banker with ten shares who recognized the problems of the company, actively pointed them out, and later added to his holdings. The next two directors were the top officers of Sanborn who owned about 300 shares combined. The officers were capable, aware of the problems of the business, but kept in a subservient role by the Board of Directors. The final member of our cast was a son of a deceased president of Sanborn. The widow owned about 15,000 shares of stock.
In late 1958, the son, unhappy with the trend of the business, demanded the top position in the company, was turned down, and submitted his resignation, which was accepted. Shortly thereafter we made a bid to his mother for her block of stock, which was accepted. At the time there were two other large holdings, one of about 10,000 shares (dispersed among customers of a brokerage firm) and one of about 8,000. These people were quite unhappy with the situation and desired a separation of the investment portfolio from the map business, as did we.
Subsequently our holdings (including associates) were increased through open market purchases to about 24,000 shares and the total represented by the three groups increased to 46,000 shares. We hoped to separate the two businesses, realize the fair value of the investment portfolio and work to re-establish the earning power of the map business. There appeared to be a real opportunity to multiply map profits through utilization of Sanborn's wealth of raw material in conjunction with electronic means of converting this data to the most usable form for the customer.
There was considerable opposition on the Board to change of any type, particularly when initiated by an outsider, although management was in complete accord with our plan and a similar plan had been recommended by Booz, Allen & Hamilton (Management Experts). To avoid a proxy fight (which very probably would not have been forthcoming and which we would have been certain of winning) and to avoid time delay with a large portion of Sanborn’s money tied up in blue-chip stocks which I didn’t care for at current prices, a plan was evolved taking out all stockholders at fair value who wanted out. The SEC ruled favorably on the fairness of the plan. About 72% of the Sanborn stock, involving 50% of the 1,600 stockholders, was exchanged for portfolio securities at fair value. The map business was left with over $l,25 million in government and municipal bonds as
a reserve fund, and a potential corporate capital gains tax of over $1 million was eliminated. The remaining stockholders were left with a slightly improved asset value, substantially higher earnings per share, and an increased dividend rate.
Necessarily, the above little melodrama is a very abbreviated description of this investment operation. However, it does point up the necessity for secrecy regarding our portfolio operations as well as the futility of measuring our results over a short span of time such as a year. Such control situations may occur very infrequently. Our bread-and-butter business is buying undervalued securities and selling when the undervaluation is corrected along with investment in special situations where the profit is dependent on corporate rather than market action. To the extent that partnership funds continue to grow, it is possible that more opportunities will be available in “control situations.”
The auditors should be mailing your financial statement and tax information within about a week. If you have any questions at all regarding either their report or this letter, be sure to let me know.
Warren E. Buffett 1-30-61
~全文完~
原创不易
如果您觉得本文有价值
还请点赞打赏,以资鼓励
(1元即可)