
译者注:
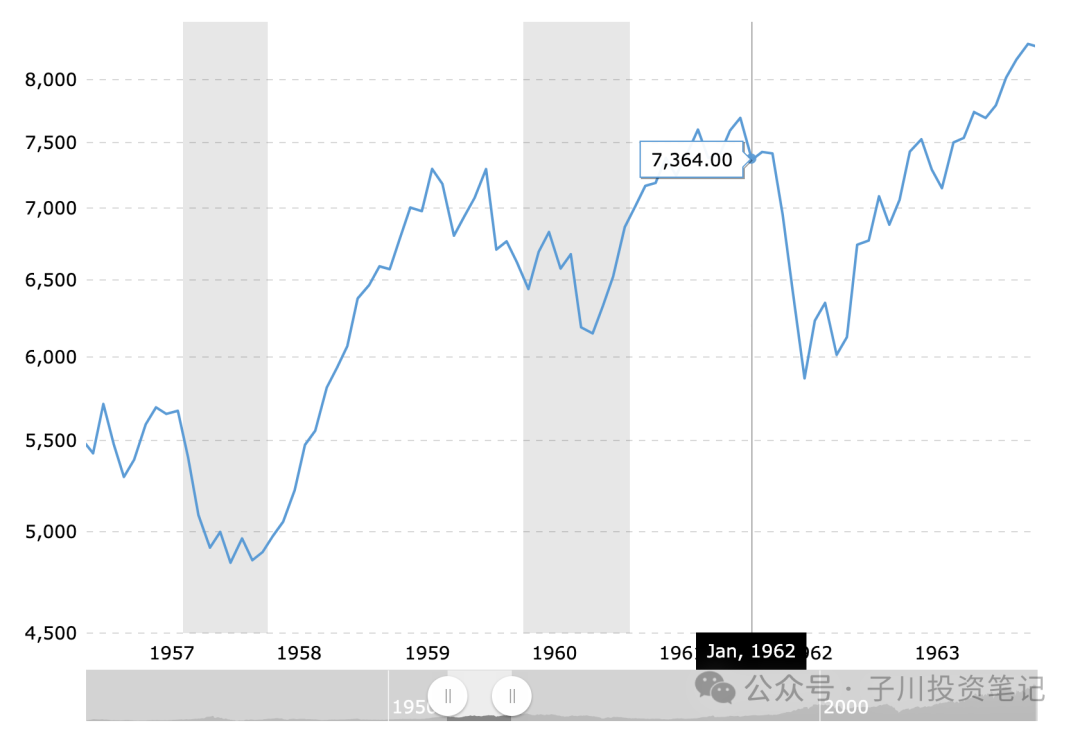
60年前的历史和当下竟有几分相似。在1950年代末到1960年代初的牛市期间,美股表现强劲,远超巴菲特说的5-7%的长期回报。造成很多投资者误以为高回报是常态。1962年1月,巴老再次对狂热的市场参与者们发出警告。在1962年中的本篇致合伙人信中,巴老用实际行情走向和数据,阐述了在不同行情下的业绩表现情况。
中文译文:
BUFFETT PARTNERSHIP, LTD.
810 KIEWIT PLAZA
OMAHA 31, NEBRASKA
July 6, 1962
回顾:
在1962年1月24日回顾1961年的股东信中,我写了一个标题为"一个预测"的章节。虽然我无意对读者施加"残酷而不寻常的惩罚",但时隔半年,完整重现那个章节,或许还是值得的:
一个预测:
常读我文章的朋友们(如果真的有)会觉得当我开始谈论预测时,我已经偏离了轨道。我一直回避预测,现在仍是如此。
我当然不会去预测未来一两年的整体经济或股市走势,因为我对此一无所知。
我认为你可以相当确定,在未来十年中,会有几年整体市场上涨20%或25%,也会有几年下跌相同幅度,而大多数时候是在两者之间。我不知道行情会以什么顺序出现,而且我认为对长期投资者来说这也不是特别重要。
长期来看,我认为道指可能会通过股息和市值增长,大约产生每年5%到7%的复合回报。尽管近年来的经验不同,但任何期望从整体市场获得明显更好回报的人可能都会失望。
(译者注:本段所指“近年”,应是1950年代末到1960年代初的牛市时期。在此期间,美股表现强劲,远超巴菲特说的5-7%的长期回报。造成很多投资者可能因此认为高回报是常态。故,巴菲特在此警告不要被近期的高回报误导。这种超高回报不具有可持续性,长期来看,市场回报会回归到5-7%的水平。)
我们的工作是在不过分担心某一年的绝对业绩是正是负的情况下,逐年累积超越道指表现的优势。我认为,我们下跌15%而道指下跌25%的年份,要比合伙企业和道指都上涨20%的年份表现更好。我一直在向合伙人强调这一点。虽然大家都点头赞同,但热情程度各不相同。对我来说,最重要的是你们对这个观点的认同不能只停留在理解层面,更要发自内心。
基于我运营方式的原因,我们相对于道指表现最好的年份可能是在下跌或不涨不跌的市场中。因此,我们寻求的优势可能会以大幅变化的形式出现。肯定会有些年份我们被道指超越,但如果从长期来看,我们能够平均每年比它好10个百分点,我就认为业绩是令人满意的。
具体来说,如果市场在某一年下跌35%或40%(我认为这种情况在未来十年中有大概率会发生一次,没人知道是哪一年),我们应该只下跌15%或20%。如果市场年内基本持平,我们希望能上涨约10个百分点。如果市场上涨20%或更多,我们将努力争取达到同样的涨幅。如果能在多年中保持这样的表现,意味着如果道指产生5%到7%的年复合增长,我希望我们的业绩增长能达到每年15%至17%。
上述预期可能听起来有些鲁莽,毫无疑问,从1965年或1970年的角度来看可能会显得非常鲁莽。可能事实会证明我完全错了。然而,我觉得合伙人们当然有权知道我在这方面的想法,尽管投资业务的性质决定了这种预期很可能会出错。在任何一年中,变化都可能相当大。这种情况在1961年就发生过,但幸运的是,那次变化令人愉快。但情况并不总会如意!
(译者注:以上回顾内容与上一封信中的相关部分完全一致,上一封信的全部内容可参考1961巴菲特致合伙人信-1962(1)-手工精译及解读)
1962年上半年:
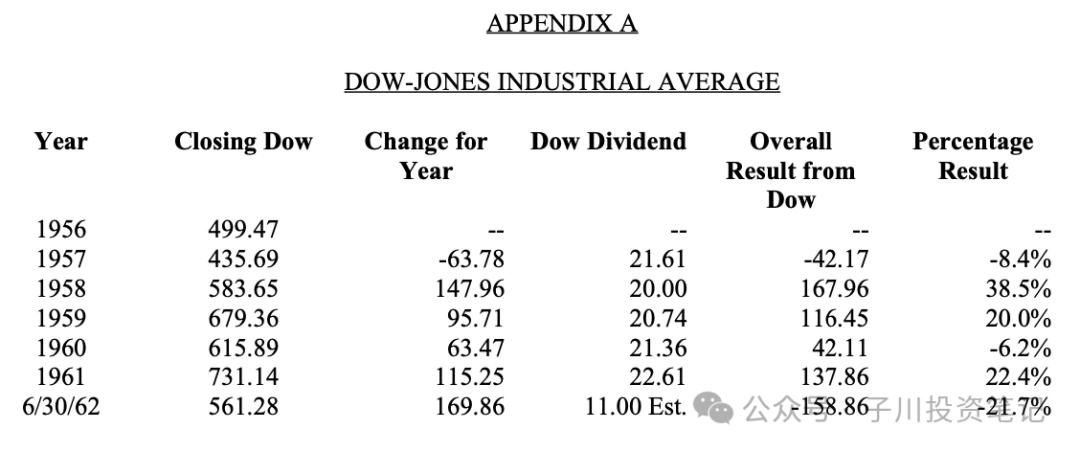
在1961年年底到1962年6月30日期间,道琼斯指数从731.14下跌到561.28。如果在此期间持有道琼斯指数,会收到约11.00美元的股息,因此投资道琼斯指数的整体损失为21.7%。对于关注统计数据的人来说,附录A给出了自前身合伙企业成立以来道琼斯指数按年度的业绩。
如上所述,下跌的道琼斯指数给我们机会来表现和积累百分比优势,这种优势加上在上涨市场中的平均表现,将给我们带来相当满意的长期结果。我们的目标是道琼斯每下跌1%,我们约下跌1/2%,如果达到这个目标,意味着我们在股票投资方面比几乎任何替代方案都更保守。
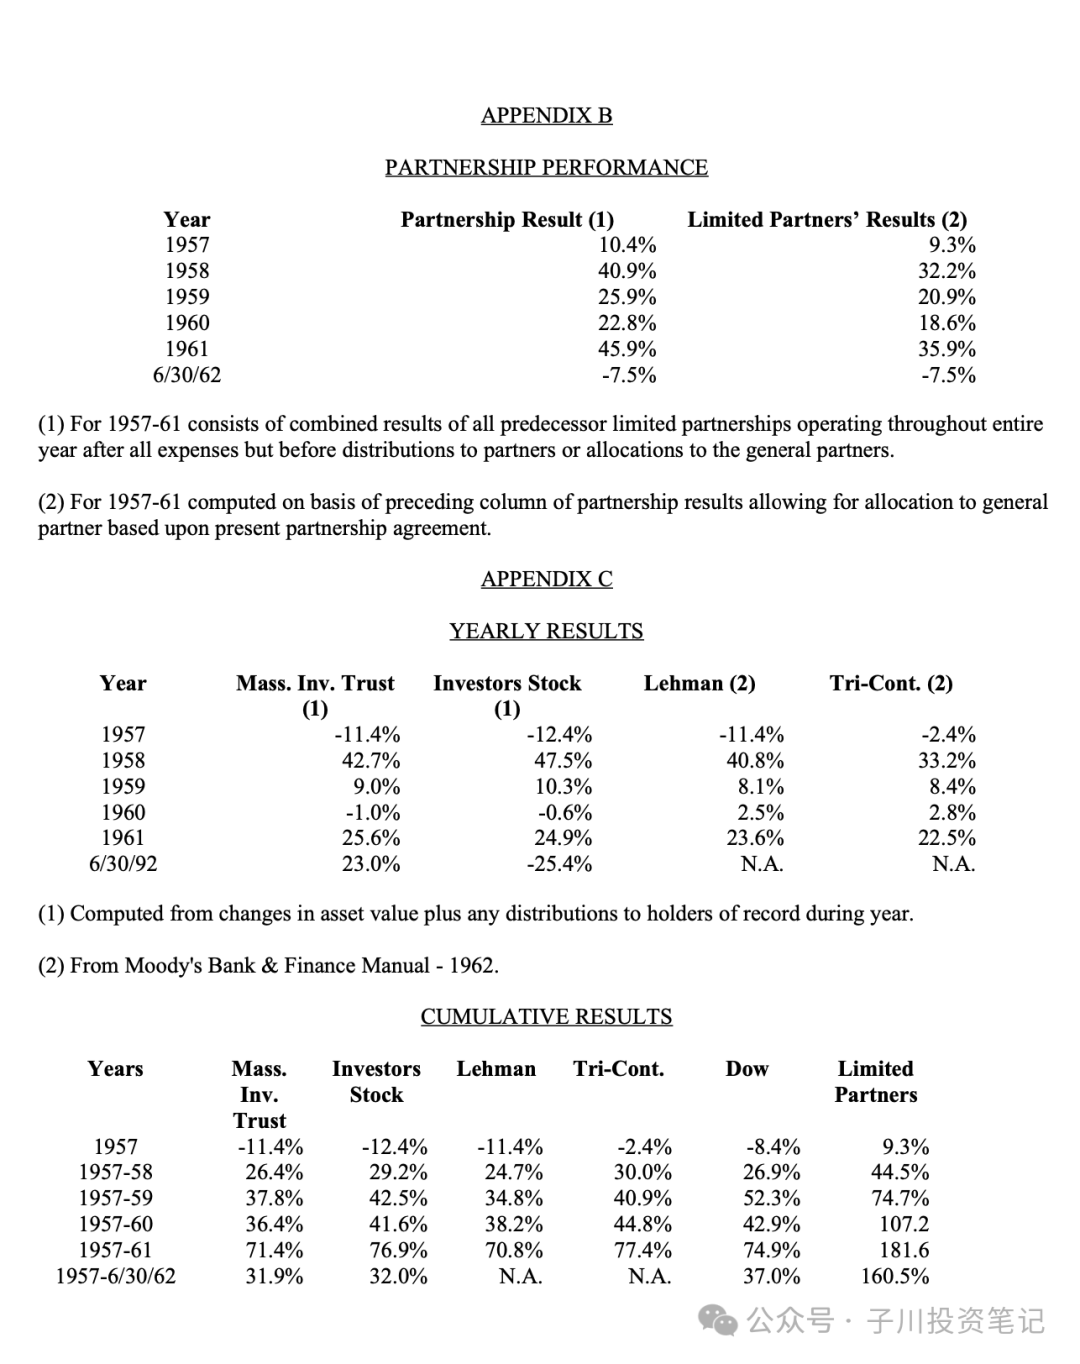
附录B展示了前身合伙企业的综合业绩,在1962年上半年,我们经历了历史上最好的时期之一,相比道琼斯的整体结果为下跌21.7%,我们实现了下跌7.5%的结果(未扣除合伙费用)。如果普通市场继续下跌,这14.2个百分点的优势预计会在下半年扩大,但如果市场转向上涨,可能会缩小。请记住我一直的告诫,即六个月甚至一年的业绩都不应该太过重视。短期测量会夸大业绩中的偶然波动。虽然环境促成了异常良好的上半年业绩,但必然会有我们表现相对较差的时期。我们的业绩数据不包括对Dempster Mill Manufacturing Company控股权估值的任何变化,尽管近几个月该公司的发展表明它可能会实现更高的价值。
投资公司在上半年的表现:
过去的股东信强调了我们的信念,即道琼斯作为投资业绩的衡量标准并非易事。就投资于普通股而言,无论是通过投资公司、投资顾问、银行信托部门还是自己投资,我们的信念是,绝大多数人将实现与道琼斯大致相当的结果。我们的观点是,与道琼斯的偏离更可能是朝着较差的表现而不是较好的表现发展。
(译者注:去年有新闻说伯克希尔连续多年跑不赢道指。好的时候,争取跟上,差的时候争取少亏)
为了说明这一点,我们一直在用道琼斯指数和有限合伙人的业绩与两家最大的开放式投资公司(共同基金)和两家最大的封闭式投资公司的普通股投资计划做比较。附录C显示了五年业绩,你会注意到这些数字与道琼斯的数字非常接近。这些公司的总资产约为35亿美元。
为了及时发出这封信,我们在获得封闭式公司的业绩之前就寄出了。然而,这两家共同基金的表现都比道琼斯差,其中Massachusetts Investors Trust整体表现为负23%,Investors Stock Fund实现了负25.4%。这并不罕见,正如1962年6月13日《华尔街日报》的头版文章"基金vs市场"所证明的那样。在研究的17家大型普通股基金中,从道琼斯734点的峰值到文章发表日期,每一家的业绩都比道琼斯差,尽管在某些情况下差距很小。
上半年受打击特别严重的是所谓"成长"基金,几乎无一例外地比道琼斯下跌得更多。前几年业绩最好的三家大型"成长"(现在引号更贴切)基金,Fidelity Capital Fund、Putnam Growth Fund和Wellington Equity Fund在上半年平均整体下跌32.3%。公平地说,由于他们在1959-61年的出色业绩,他们迄今为止的整体表现仍然优于平均水平,将来可能也会如此。然而,具有讽刺意味的是,这种早期的优异表现导致大量新投资者涌入,以至于今年的糟糕表现影响到的持有人远多于享受早期优异表现的人数。这种经验倾向于证实我的假设:投资业绩必须在一段时间内进行判断,必须包括上涨和下跌。现在理解这点可能比半年前容易些。
我概述上面投资公司的业绩,并不是因为我们的运作方式与它们相似,或者我们的投资与它们相似。比较的目的是因为这些基金代表了专业、高薪的投资管理人员处理200亿美元级别证券的公开平均水平。我相信,这种管理方式代表了处理更大资金的典型管理方式。作为合伙企业权益的替代选择,我认为合理地假设许多合伙人的投资会以类似方式管理。
(译者注:有的时候别人提及一个信息,并不代表就看好或者要付诸行动,可能只是这个信息能够代表市场中一部分人的观点,值得拿来做比较而已。这种偏误在消息面分析中,尤其是重灾区)
资产价值:
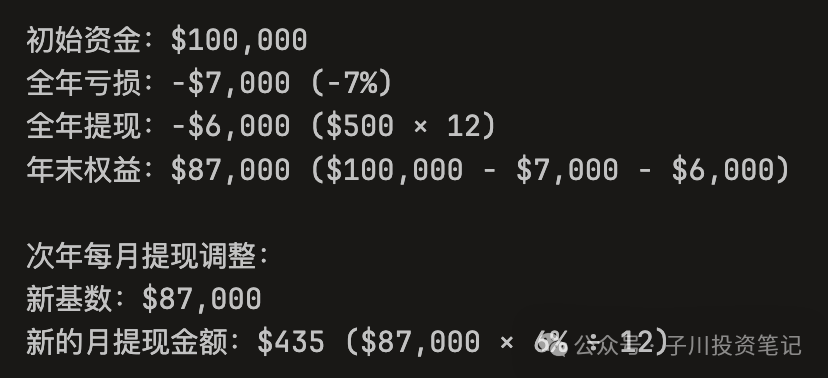
上述业绩计算是在向普通合伙人分配和向合伙人每月支付之前进行的。当然,只要全年的整体业绩不超过市值基础上的6%(且亏损结转),就不会向普通合伙人分配。因此,未提取的合伙人在前六个月的市值权益下降了7.5%,以每年6%的比率提取的合伙人在上半年的市值权益下降了10.5%。如果我们全年的业绩低于+6%(除非道琼斯出现实质性上涨,否则这种情况很可能发生),接受每月支付的合伙人在1962年12月31日的市值权益将会下降。这意味着明年按这个新的市值权益6%计算的每月支付将按比例减少。例如,如果我们全年的整体业绩为负7%,一个接受每月支付的合伙人,在1962年1月1日有100,000美元市值权益,到1962年12月31日的权益将为87,000美元。这种减少来自负7%的结果,即7,000美元,加上每月500美元的支付共6,000美元。因此,在1963年1月1日市值权益为87,000美元的情况下,明年的每月支付将为435.00美元。
(译者注:
对于选择每年6%的比率提取的合伙人,计算如下:
当然,上述所有内容都不适用于1962年收到的预付款,这些预付款不参与损益分配,而是赚取单纯的6%。
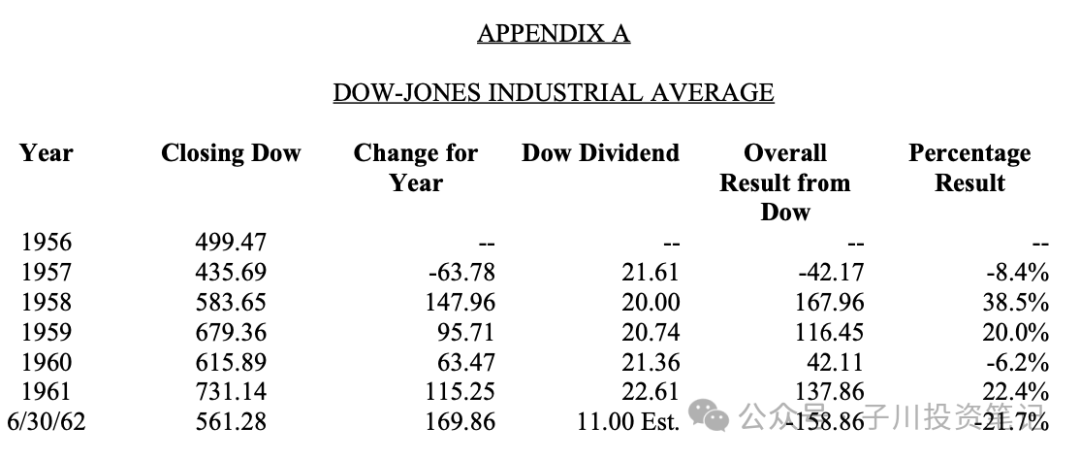
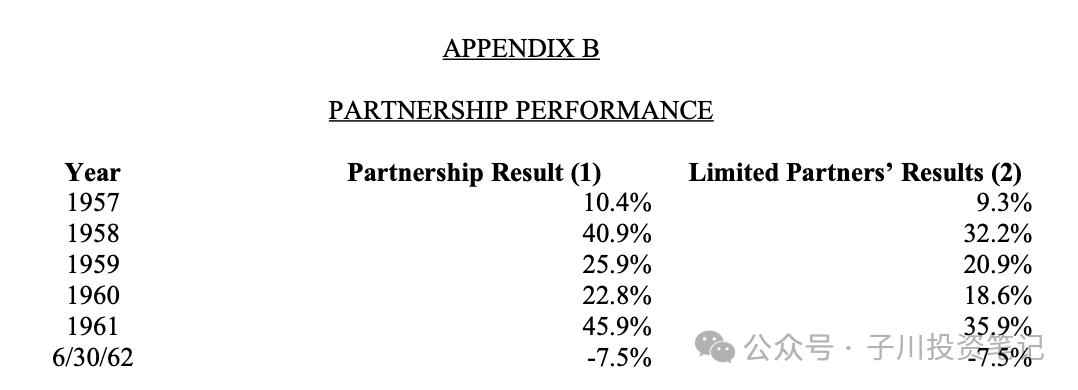
(1) 1957-61年的数据是所有前身有限合伙企业在扣除所有费用但在向合伙人分配利润或向普通合伙人分配收益之前的全年综合业绩。
(2) 1957-61年的数据是基于前一栏的合伙企业业绩,并按照现有合伙协议对普通合伙人的分配比例进行计算。
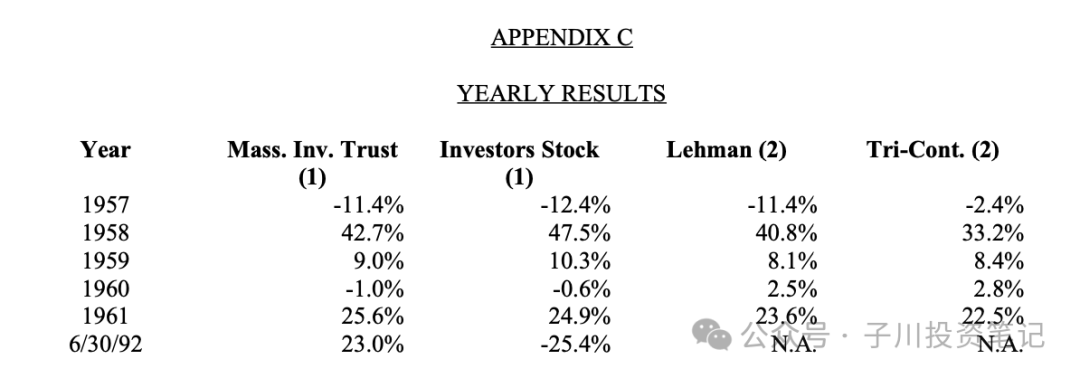
(1) 根据资产价值变动加上当年向在册持有人的任何分配计算得出。
(2) 数据来源:穆迪银行与金融手册(1962年版)。
BUFFETT PARTNERSHIP,
LTD. 810 KIEWIT PLAZA
OMAHA 31, NEBRASKA
July 6, 1962
A Reminder:
In my letter of January 24, 1962 reporting on 1961, I inserted a section entitled. "And a Prediction." While I have no desire to inflict cruel and unusual punishment upon my readers, nevertheless, a reprinting of that section, in its entirety, may be worthwhile:
And a Prediction
Regular readers (I may be flattering myself) will feel I have left the tracks when I start talking about predictions. This is one thing from which I have always shied away and I still do in the normal sense.
I am certainly not going to predict what general business or the stock market are going to do in the next year or two since I don't have the faintest idea.
I think you can be quite sure that over the next ten years there are going to be a few years when the general market is plus 20% or 25%, a few when it is minus on the same order, and a majority when it is in between. I haven't any notion as to the sequence in which these will occur, nor do I think it is of any great importance for the long-term investor.
Over any long period of years, I think it likely that the Dow will probably produce something like 5% to 7% per year compounded from a combination of dividends and market value gain. Despite the experience of recent years, anyone expecting substantially better than that from the general market probably faces disappointment.
Our job is to pile up yearly advantages over the performance of the Dow without worrying too much about whether the absolute results in a given year are a plus or a minus. I would consider a year in which we were down 15% and the Dow declined 25% to be much superior to a year when both the partnership and the Dow advanced 20%. I have stressed this point in talking with partners and have watched them nod their heads with varying degrees of enthusiasm.
It is most important to me that you fully understand my reasoning in this regard and agree with me not only in your cerebral regions, but also down in the pit of your stomach.
For the reasons outlined in my method of operation, our best years relative to the Dow are likely to be in declining or static markets. Therefore, the advantage we seek will probably come in sharply varying amounts. There are bound to be years when we are surpassed by the Dow, but if over a long period we can average ten percentage points per year better than it, I will feel the results have been satisfactory.
Specifically, if the market should be down 35% or 40% in a year (and I feel this has a high probability of occurring one year in the next ten--no one knows which one), we should be down only 15% or 20%. If it is more or less unchanged during the year, we would hope to be up about ten percentage points. If it is up 20% or more, we would struggle to be up as much. The consequence of performance such as this over a period of years would mean that if the Dow produces a 5% to 7% per year over-all gain compounded, I would hope our results might be 15% to 17% per year.
The above expectations may sound somewhat rash, and there is no question but that they may appear very much so when viewed from the vantage point of 1965 or 1970. It may turn out that I am completely wrong. However, I feel the partners are certainly entitled to know what I am thinking in this regard even though the nature of the business is such as to introduce a high probability of error in such expectations. In anyone year, the variations may be quite substantial. This happened in 1961, but fortunately the variation was on the pleasant side. They won't all be!
The First Half of 1962:
Between yearend 1961 and June 30, 1962 the Dow declined from 731.14 to 561.28. If one had owned the Dow during this period, dividends of approximately $11.00 would have been received so that overall a loss of 21.7% would have been the result of investing in the Dow. For the statistical minded, Appendix A gives the results of the Dow by years since formation of the predecessor partnerships.
As stated above, a declining Dow gives us our chance to shine and pile up the percentage advantages which, coupled with only an average performance during advancing markets, will give us quite satisfactory long-term results. Our target is an approximately 1/2% decline for each 1% decline in the Dow and if achieved, means we have a considerably more conservative vehicle for investment in stocks than practically any alternative.
As outlined in Appendix B, showing combined predecessor partnership results, during the first half of 1962 we had one of the best periods in our history, achieving a minus 7.5% result before payments to partners, compared to the minus 21.7% overall result on the Dow. This 14.2 percentage points advantage can be expected to widen during the second half if the decline in the general market continues, but will probably narrow should the market turn upward. Please keep in mind my continuing admonition that six-months' or even one-year's results are not to be taken too seriously. Short periods of measurement exaggerate chance fluctuations in performance. While circumstances contributed to an unusually good first half, there are bound to be periods when we do relatively poorly. The figures for our performance involve no change in the valuation of our controlling interest in Dempster Mill Manufacturing Company, although developments in recent months point toward a probable higher realization.
Investment Companies during the First Half:
Past letters have stressed our belief that the Dow is no pushover as a yardstick for investment performance. To the extent that funds are invested in common stocks, whether the manner of investment be through investment companies, investment counselors, bank trust departments, or do-it-yourself, our belief is that the overwhelming majority will achieve results roughly comparable to the Dow. Our opinion is that the deviations from the Dow are much more likely to be toward a poorer performance than a superior one.
To illustrate this point, we have continually measured the Dow and limited partners' results against the two largest open-end investment companies (mutual funds) following a program of common stock investment and the two largest closed-end investment companies. The tabulation in Appendix C shows the five -years' results, and you will note the figures are extraordinarily close to those of the Dow. These companies have total assets of about $3.5 billion.
In the interest of getting this letter out promptly, we are mailing it before results are available for the closed-end companies. However, the two mutual funds both did poorer than the Dow, with Massachusetts Investors Trust having a minus 23% overall performance, and Investors Stock Fund realizing a minus 25.4%. This is not unusual as witness the lead article in the WALL STREET JOURNAL of June 13, 1962 headed "Funds vs. Market.” Of the 17 large common stock funds studied, everyone had a record poorer than the Dow from the peak on the Dow of 734, to the date of the article, although in some cases the margin of inferiority was minor.
Particularly hard hit in the first half were the so-called “growth” funds which, almost without exception, were down considerably more than the Dow. The three large "growth" (the quotation marks are more applicable now) funds with the best record in the preceding few years, Fidelity Capital Fund, Putnam Growth Fund, and Wellington Equity Fund averaged an overall minus 32.3% for the first half. It is only fair to point out that because of their excellent records in 1959-61, their overall performance to date is still better than average, as it may well be in the future. Ironically, however, this earlier superior performance had caused such a rush of new investors to come to them that the poor performance this year was experienced by very many more holders than enjoyed the excellent performance of earlier years. This experience tends to confirm my hypothesis that investment performance must be judged over a period of time with such a period including both advancing and declining markets. There will continue to be both; a point perhaps better understood now than six months ago.
In outlining the results of investment companies, I do so not because we operate in a manner comparable to them or because our investments are similar to theirs. It is done because such funds represent a public batting average of professional, highly-paid investment management handling a very significant $20 billion of securities. Such management, I believe, is typical of management handling even larger sums. As an alternative to an interest in the partnership, I believe it reasonable to assume that many partners would have investments managed similarly.
Asset Values:
The above calculations of results are before allocation to the General Partner and monthly payments to partners. Of course, whenever the overall results for the year are not plus 6% on a market value basis (with deficiencies carried forward) there is no allocation to the General Partner. Therefore, non-withdrawing partners have had a decrease in their market value equity during the first six months of 7.5% and partners who have withdrawn at the rate of 6% per annum have had a decrease in their market value equity during the first half of 10.5%. Should our results for the year be less than plus 6% (and unless there should be a material advance in the Dow, this is very probable) partners receiving monthly payments will have a decrease in their market value equity at December 31, 1962. This means that monthly payments at 6% on this new market equity next year will be on a proportionately reduced basis. For example, if our results were an overall minus 7% for the year, a partner receiving monthly payments who had a market value interest of $100,000 on January 1, 1962 would have an equity at December 31, 1962 of $87,000. This reduction would arise from the minus 7% result, or $7, 000 plus monthly payments of $500 for an additional $6,000. Thus, with $87,000 of market equity on January 1, 1963, monthly payments next year would be $435.00.
None of the above, of course, has any applicability to advance payments received during 1962 which do not participate in profits or losses, but earn a straight 6%.
~完~
感谢阅读,麻烦点个👍和❤️,谢谢!